Introduction
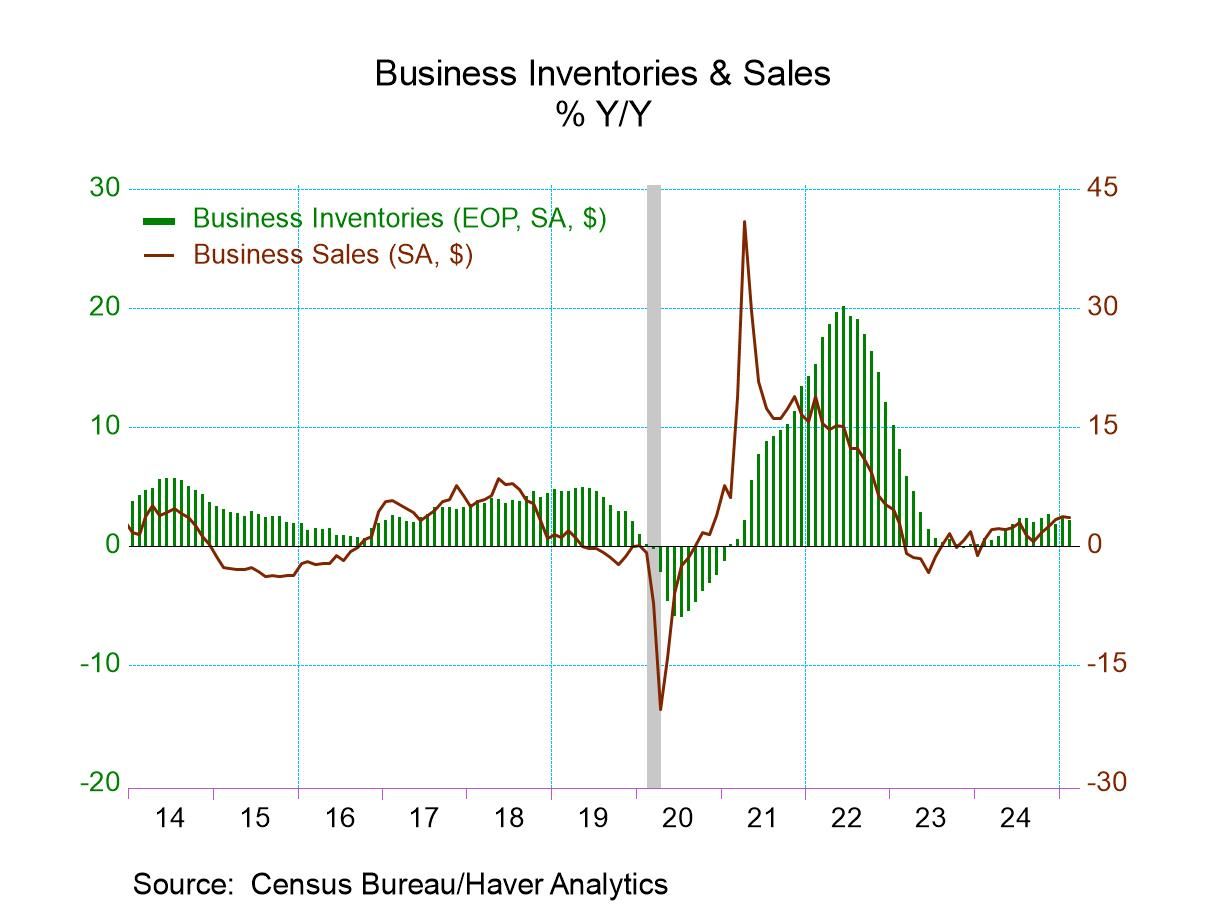
The Business Inventories Report is a vital economic indicator published monthly by the U.S. Census Bureau. It provides insights into the stock levels of manufacturers, wholesalers, and retailers, reflecting the health and direction of the U.S. economy. On February 14, 2018, the Census Bureau released data pertaining to inventories and sales figures for December 2017. This report is crucial for economists, investors, and policymakers to understand inventory trends and their implications on economic growth.
Overview of the Report
The Manufacturing and Trade Inventories and Sales Report encompasses data from three primary sectors:
-
Manufacturing: Data derived from the Manufacturers’ Shipments, Inventories, and Orders Survey.
-
Wholesale: Information collected through the Monthly Wholesale Trade Survey.
-
Retail: Figures obtained from the Monthly Retail Trade Survey.
These combined datasets offer a comprehensive view of the total business inventories and sales in the United States.
Key Findings from the December 2017 Data
Total Business Inventories
As of the end of December 2017, total business inventories were valued at $1,905.7 billion, marking a 0.4% increase from November 2017. This rise indicates that businesses were stocking up, possibly in anticipation of increased demand or as a response to supply chain considerations.
Total Business Sales
Total sales for December 2017 amounted to $1,430.5 billion, reflecting a 0.6% increase from the previous month. This uptick suggests a healthy consumer demand during the holiday season, which is typically a peak period for retail sales.
Inventories-to-Sales Ratio
The inventories-to-sales ratio stood at 1.33, slightly down from 1.34 in November 2017. This ratio indicates the number of months it would take to sell the current inventory at the existing sales pace. A lower ratio often signifies robust sales or leaner inventories, both of which can be positive economic indicators.
Sector-Specific Analysis
Manufacturing Sector
-
Inventories: Increased by 0.3% to $660.9 billion.
-
Sales: Rose by 0.6% to $492.8 billion.
-
Inventories-to-Sales Ratio: Remained steady at 1.34.
The manufacturing sector showed consistent growth, with inventories and sales moving in tandem, suggesting balanced production and demand.
Wholesale Sector
-
Inventories: Went up by 0.4% to $612.1 billion.
-
Sales: Increased by 1.2% to $497.1 billion.
-
Inventories-to-Sales Ratio: Decreased to 1.23 from 1.24 in November.
The wholesale sector experienced a notable rise in sales, outpacing inventory growth, leading to a slight decrease in the inventories-to-sales ratio.
Retail Sector
-
Inventories: Rose by 0.2% to $632.7 billion.
-
Sales: Increased by 0.3% to $440.6 billion.
-
Inventories-to-Sales Ratio: Held steady at 1.44.
Retailers maintained a cautious approach, with modest inventory accumulation aligning closely with sales growth, reflecting prudent inventory management during the holiday season.
Implications for the Economy
The data from December 2017 indicates a healthy economic environment:
-
Consumer Confidence: The increase in sales across all sectors suggests strong consumer confidence and spending.
-
Inventory Management: Businesses appear to be managing inventories effectively, avoiding overstocking while meeting demand.
-
Economic Growth: Balanced inventory and sales growth contribute positively to GDP calculations, indicating steady economic expansion.
Total Business Inventories and Sales Overview
In December 2017, total business inventories reached $1,905.7 billion, marking a 0.4% increase from the previous month. Simultaneously, total business sales rose to $1,430.5 billion, a 0.6% uptick from November 2017. These figures suggest a balanced growth in inventories and sales, indicating steady demand and supply dynamics.
Inventories-to-Sales Ratio
The inventories-to-sales ratio, a key indicator of how long current inventory levels would last at the current sales pace, stood at 1.33 in December 2017, slightly down from 1.34 in November. This decrease implies that sales were outpacing inventory accumulation, a positive sign of robust demand.
Sector-Specific Insights
Manufacturing Sector
-
Inventories: Increased by 0.3% to $660.9 billion.
-
Sales: Rose by 0.6% to $492.8 billion.
-
Inventories-to-Sales Ratio: Remained steady at 1.34.
The manufacturing sector exhibited consistent growth, with inventories and sales moving in tandem, reflecting balanced production and demand.
Wholesale Sector
-
Inventories: Increased by 0.4% to $612.1 billion.
-
Sales: Rose by 1.2% to $497.1 billion.
-
Inventories-to-Sales Ratio: Decreased to 1.23 from 1.24 in November.
The wholesale sector experienced a notable rise in sales, outpacing inventory growth, leading to a slight decrease in the inventories-to-sales ratio.
Retail Sector
-
Inventories: Rose by 0.2% to $632.7 billion.
-
Sales: Increased by 0.3% to $440.6 billion.
-
Inventories-to-Sales Ratio: Held steady at 1.44.
Retailers maintained a cautious approach, with modest inventory accumulation aligning closely with sales growth, reflecting prudent inventory management during the holiday season.
Economic Implications
The data from December 2017 indicates a healthy economic environment:
-
Consumer Confidence: The increase in sales across all sectors suggests strong consumer confidence and spending.
-
Inventory Management: Businesses appear to be managing inventories effectively, avoiding overstocking while meeting demand.
-
Economic Growth: Balanced inventory and sales growth contribute positively to GDP calculations, indicating steady economic expansion.
Conclusion
The Business Inventories Report released on February 14, 2018, paints a picture of a robust U.S. economy at the close of 2017. With sales outpacing inventory growth in several sectors, businesses demonstrated efficient inventory management and responsiveness to consumer demand. These trends are indicative of a healthy economic trajectory, setting a positive tone for the beginning of 2018.

